
Unit Plan: Rate/Ratio/Percentage
Math / Grade 8
Big Ideas
Comparison of quantities is key to understanding rate, ratio and percent.
Essential Questions
Students will keep considering…
- What is the best way to represent a quantity?
- What is the role of reasoning when making decisions?
Evaluative Criteria
Teacher Evaluative Criteria:
N/A
Monitoring Progress
N/A
Resources
BOOKS
- Mathlinks8 Textbook or other Math 8 Resource
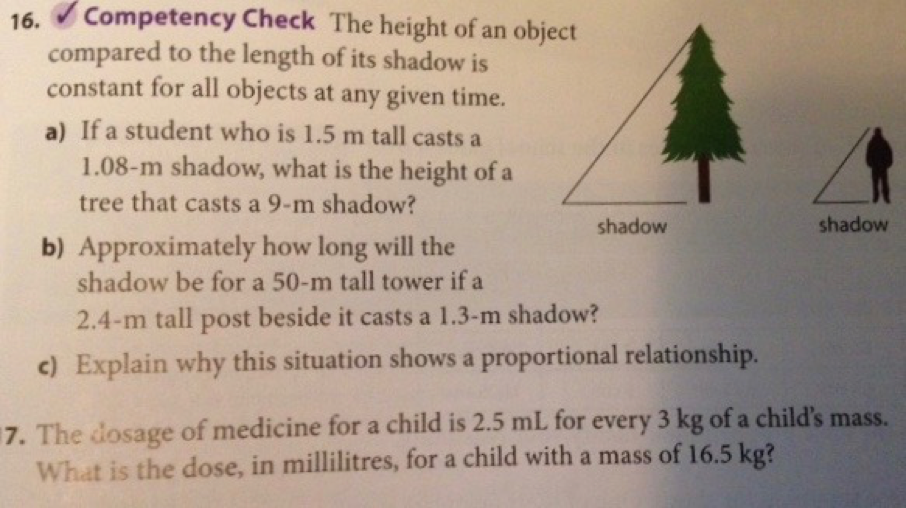
- Beyond Monet by Barry Bennett
Reflection
How will teachers and their students reflect on and evaluate the completed project?
Teacher:
Next time I teach this unit I would…
Allow students to select the short stories that link to Identity.
Student:
My students needed:
Process:
Product:
Content:
Potential Student Misunderstanding:
Notes throughout lessons.
Downloads
Stage 3 – Learning Plan
EXECUTE THE LEARNING PLAN
LEARNING EVENTS:
- These learning events/activities are suggested activities only.
- In some cases the plans are not fully completed lesson plans.
- The teacher may choose some lessons/activities to span over several lessons.
- Teachers may add, revise and adapt these lessons based on the needs of their students, their personal preferences for resources, and the use of a variety of instructional techniques.
Learning events are enriched for students when teachers consider the “WHERE TO” acronym and guiding organizer by Wiggins and McTighe.
The Learning Events should always be prefaced by focusing on the essential questions:
- What is the best way to represent a quantity?
- What is the role of reasoning when making decisions?
Acquisition-Meaning-Transfer
Lesson 1 - Review of Key Ideas for Ratios
The Learning Events should always be prefaced by focusing on the essential questions:
- What is the best way to represent a quantity?
- What is the role of reasoning when making decisions?
Review of Key Ideas for Ratios (Lesson 1)
Provide Students with samples of things that can be represented as ratios. This can be done as a whole class activity or as a stations activity. (M)
Example 1: Photos enlarged or reduced


Questions to consider:
How might you compare the size of the images mathematically? What measurements would you need to make?
How would it change things if the larger photo was the original and the smaller was a reduction?
What information would you need to know to determine the scale of the photos?
Student Activity: (M)
Provide Students with graph paper and ask students to draw an irregular shape using the graph paper. Then draw an enlargement or a reduction of the shape on the graph paper.
- How does the size of your second image compare to the first?
- Is the size comparison between the two drawings the same for all parts of the drawing? Why or why not?
- What is the best way to express this comparison mathematically? Why?
- How can you use ratios to express size comparison of enlarged and reduced images?
Example 2: Playing Cards
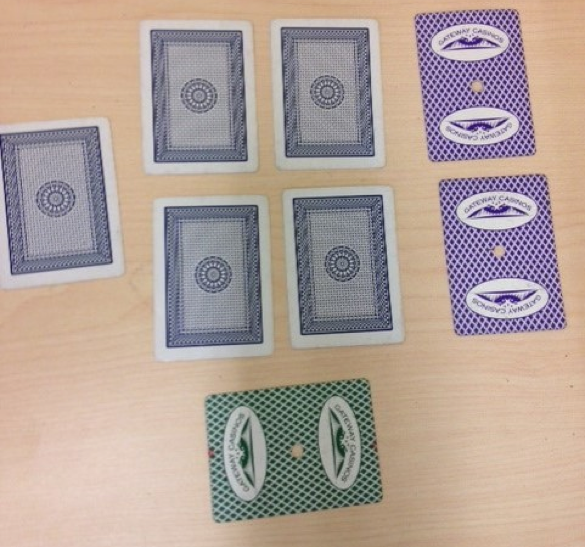
How many different ratios can you write using these cards?
How many cards of each colour would there be if I tripled the number of cards? Halved the number of cards?
List all ratios (A)
Review Vocabulary and examples to include: (A)
- two-term ratio (a comparison of two numbers)
- three-term ratio (a comparison of three numbers)
- part-to-part ratio (compares different parts of a group to each other)
- part-to-whole ratio (compares one part of a group to the entire group)
How are these two examples the same? Different?
What common mathematical language can you use for each of these problems?
Summary:
Students should be able to describe what a ratio is and how to express a ratio in at least two different ways.
Students should be able to write a ratio in lowest terms.
Formative Assessment:
Provide students with a handful of three coloured cubes to write ratios that are a two-term ratio, a three-term ratio, a part-to-part ratio and a part-to-whole ratio.
Student Work:
Students can complete questions from a resource that practice writing ratios from diagrams or word problems and reducing ratios to smallest terms.
Lesson 2 - Application of Ratios
The Learning Events should always be prefaced by focusing on the essential questions:
- What is the best way to represent a quantity?
- What is the role of reasoning when making decisions?
Lesson 2 – Applications of Ratios (Lesson 2)
Students should be able to identify ratios, and write ratios for sets of items. Students should be able to write ratios in lowest terms or scale-up ratios given the situation. (A)
This lesson will focus on the application of ratios.
Consider a question such as:
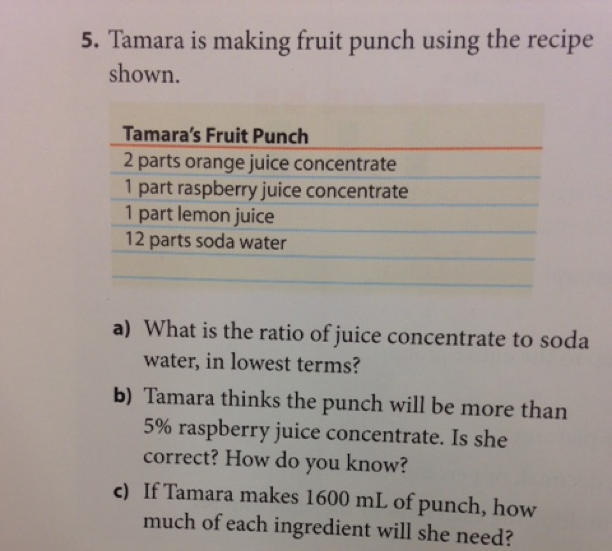
(from Mathlinks 8: Page 228 #5) (M)
This question provides an opportunity for students to move beyond simple ratios and apply their knowledge to a mixtures math problem.
Encourage students to represent their answer visually and mathematically. If students used a bar graph to show the different part of the ratio, the will have an opportunity to visualize the ratios.
Adaptations:
Write at least three ratios for Tamara’s Fruit Punch using at least two items.
Formative Assessment:
Students should be able to apply their definitions of ratios to this scenario. Students should be able to identify at least three different ratios and use different types of ratios such as part:part or part:whole. Students may also need to create a table to solve c). What ways can Tamara apply the ratio to determine the volume of each ingredient?
Provide students with an opportunity to practice application of ratio problems, such as Mathlinks 8, Page 228-229 #6-12.
Extensions:
The Golden Ratio/Fibonacci
Lesson 3 - Introduction to Rates
The Learning Events should always be prefaced by focusing on the essential questions:
- What is the best way to represent a quantity?
- What is the role of reasoning when making decisions?
Introduction to Rates (Lesson 3)
Rates are used to relate 2 different quantities. (A)
Ask partners to discuss and make a decision about the best buy for the following: (M)
20 pack of soda for $10.39
12 pack of soda for $6.29
Ask students what other things do you need to know about these products before making a decision?
For example, what are the sizes of the products? Is one a diet product? How many cans do you need? Which can is cheaper?
What is the unit rate per can? Why is this an important quantity to know?
Class Activity:
Students write down a unique quantity and an item on a piece of paper. For example, 3 pencils. Students pair up randomly and join items to create a rate. Example 3 pencils and 10 erasers.
With each pair students create: (M)
- A decision to determine which item is the better deal and justify their answer.
- Create a unit rate, for example 1 pencil per 3.3 erasers.
Students can pair up a few times and make a prize for the craziest rate.
Brainstorm:
Where do we use rates in our day-to-day lives? Students should start to identify rates used such as km/h. (T)
What is a unit rate? (A)
If it takes approximately 9.5 hours to drive from 970 km from Vancouver to Calgary. What is the average speed?
Consider a question such as:
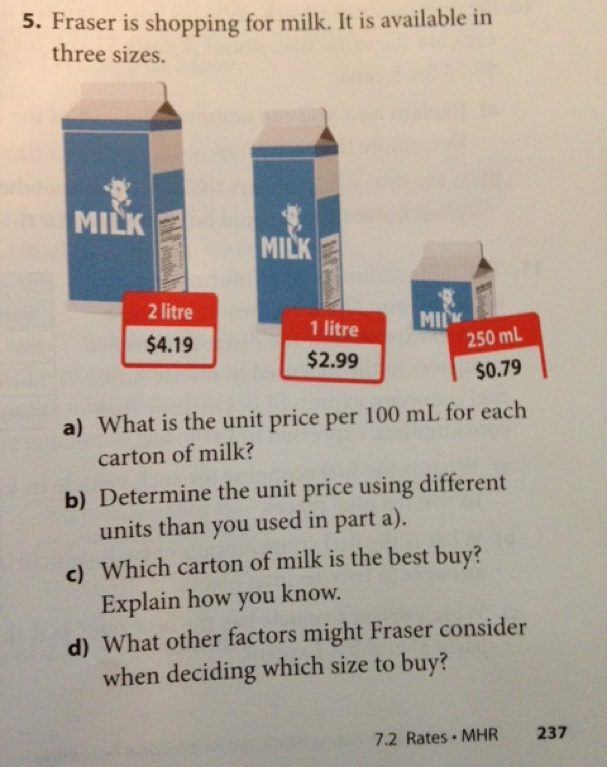
(from Mathlinks 8: Page 237 #5 (M))
Adaptations:
Students may need to use calculators to determine unit rate. Students may also need support about how to write the rate such as price/liter vs. liter/price.
Formative Assessment:
Students need to be able to write two terms as a rate and determine and compare unit rates.
Student Work:
Questions such as Mathlinks 8, Section 7.2 #6-10 provides a variety of rate application questions.
Extension:
Students can use the concept of Unit Rate to make a decision about a purchase they may make. Students research two or more similar items, determine unit rate, other key variables and share their decision in small groups or with the class.
Lesson 4 - Proportional Reasoning
The Learning Events should always be prefaced by focusing on the essential questions:
- What is the best way to represent a quantity?
- What is the role of reasoning when making decisions?
Proportional Reasoning (Lesson 4)
Proportional Reasoning leads from the topic of rates since once a rate is known, it can be doubled, tripled, halved, etc.
Provide students with a rate such as: (M)
Jane can solve 12 math problems in 15 minutes.
How long will it take Jane to solve 40 problems?
How long will it take Jane to solve 2 problems?
If Jane works at the same rate, how many problems can she solve in 22 minutes?
Students will need to use proportional reasoning to determine the solution to these questions.
Partner Activity:
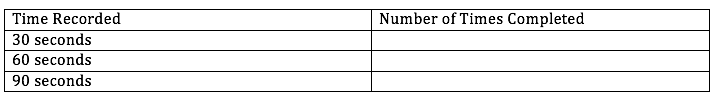
How many can I? (T)
Students will pick an activity that can be completed safely indoors such as jumping jacks, finger snapping, hand clapping, etc.
Students will time each other for increments of 30 seconds, 60 seconds and 90 seconds and record the number of times the activity was completed in a table.
Students will graph the data and determine if they completed the activity at the same rate. How will they know if they used a proportional rate?
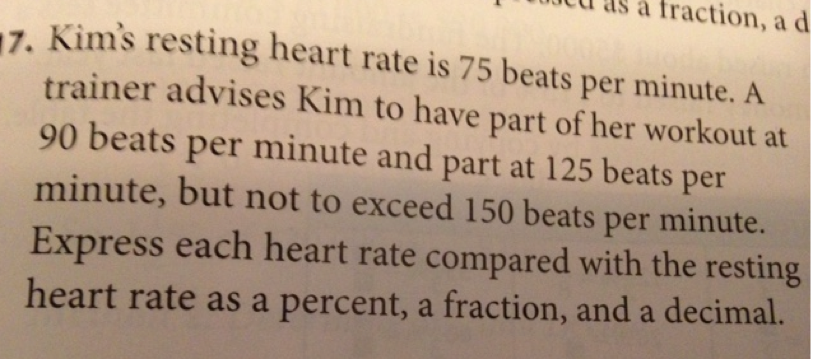
Consider the questions from Mathlinks 8 Page 247 #16 and #17 (M)
Formative Assessment:
Students should be able to determine a rate and use proportional reasoning to increase or decrease the rate. Ensure that students apply the proportion to both the numerator and denominator.
Adaptations:
Provide the rate and the proportional rate and ask students to determine the factor of increase or decrease.
Extension:
Rate of Work Problems such as
If it takes Jack 6 hours to mow the lawn and Jackie 4 hours to mow the lawn, how long will it take to mow the lawn together? (T)
Lesson 5 - Understanding Large and Small Percent
The Learning Events should always be prefaced by focusing on the essential questions:
- What is the best way to represent a quantity?
- What is the role of reasoning when making decisions?
Research Project (Lesson 5)
This section will provide students with an understanding of percentages larger than 100% and smaller than 1%. (A)
Class Activity: (M)
Provide students with a starting number and percentage such as
12 represents 10%
Ask students to write the value in the middle of the page/white board. What other percentages can you find? Find higher percentages and lower percentages? Such as 24 represents 20% or 6 represents 5%.
Ask students to play with proportional reasoning from the last section. What is 100%? If you double one side, double the other so 24 represents 20%. Continue to scale up past 100% and divide until the values are smaller than 1%.
This activity shows students that proportional reasoning can be used to solve complex problems using basic skills.
This activity also shows students understanding of proportional reasoning and mental math skills.
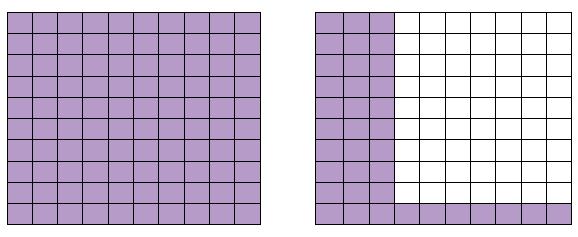
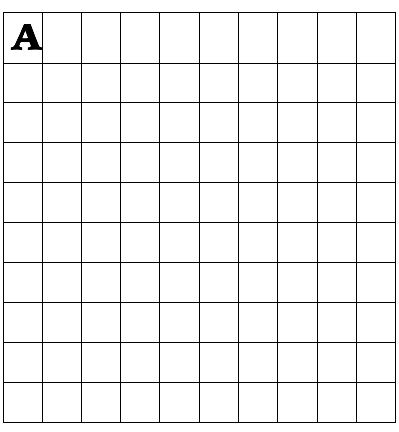
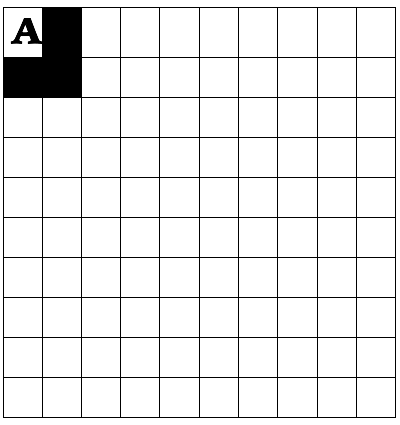
Exploring Percentage Visually:
Present students with the following visuals to determine percentage values.
Given 100 squares presents the whole (100%), what percentage of squares is shaded?
What percentage is shown in yellow?

What percentage does the A show?
What percentage is shown by all the black in this grid?
Summary:
Students should be able to explain a percent less than 1 and greater than 100.
Formative Assessment:
(M) Provide students with a grid and ask students to colour in percentages such as:
0.5%, 1.5%, 4%, 22%, 126%.
Student Work:
Students could practice questions such as Mathlinks 8, Section 7.3, #6-14 to show a variety of applications of proportional reasoning.
Extension: (T)
1/9 of students in the class do not play sports. Of the remaining students, 5/8 of students play team sports and the remaining, 9 students participate in individual sports. How many students do not play sports? How many students play team sports? How many students play individual sports? How many students are in the class? Show your solution visually.
Lesson 6 - Fractions, Decimals and Percents
The Learning Events should always be prefaced by focusing on the essential questions:
- What is the best way to represent a quantity?
- What is the role of reasoning when making decisions?
Fractions, Decimals and Percents (Lesson 6)
Multiple representation of fractions, decimals and percents. Students should be able to convert amongst the three representations for percents that are less than one, between 1 and 100, and greater than 100. (A)
Class Activity: (A)
Check in with the class with the following question adapted from (Mathlinks8, Section 8.2, #11):
Arrange the following numbers in ascending order: (145%, %, 1.32, 0.65, 33.5%).
Rewrite the numbers with their equivalencies so that there is one row of percentages, one row of decimals and one row of decimals in ascending order.
This problem will provide formative feedback in terms of a student’s ability to convert amongst the three groups.
Focus on Converting Fractions to Percentages
Students may have previous knowledge about this process. Provide students with an opportunity to show their understanding of each process and then clarify the patterns.
Review:
What is a percentage? Give examples of common uses of percentages. (A)
Convert the following fractions to fractions with a common denominator or 100.

How do these fractions with a denominator relate to a percentage? Convert to a percentage using the correct notation.
Increase the difficulty of the fractions by adding in values such as
![]()
Use decimals to show equivalency and percentages.
Use decimals to show equivalency and percentages.
Converting Fractions to Decimals and then Percents
Students may be familiar with using their calculator to solve a percentage problem. If a basketball player scored 21 baskets out of 46 basket attempts what percentage did she make?
Students may use (21/46 )*100 to calculate the percent.
Exploring the relationship between Percentages and Decimals
Provide students with a set of equivalencies such as:
36% = 0.36
125%=1.25
3%=0.03
0.5%=0.005
1.45% = .00145
Ask students to consider how a percentage is calculated given a decimal and how a decimal value is converted into a percentage. Students must have methods that work for every given value and be able to apply this method to any given value.
Use a concept attainment approach to generating this understanding. See Beyond Monet by Barrie Bennett for further explanations and examples.
Check for understanding with a question such as:
(from Mathlinks8, Section 8.2, #17) (M)
Lesson 7 - Percent of a Number
The Learning Events should always be prefaced by focusing on the essential The Learning Events should always be prefaced by focusing on the essential questions:
- What is the best way to represent a quantity?
- What is the role of reasoning when making decisions?
Percent of a Number (Lesson 7)
Throughout this unit, we have explored percent and the percent of a number. This section will continue to develop this concept with multiple strategies to problem solve percent of a number questions. (M)
Class Activity: (M)
Given 50% of a number equals 32 and 10 percent of the same number equals 6.4, find at least 10 other percentages using theses values. Can you find any fraction benchmarks?
Percent Benchmarks: Common percents that have a simple fractional equivalent and percents that are convenient to work with using mental math such as 20%, 25%, 30%, etc.
Playing with Percents
Number Talk:
A great class activity is to ask students a question relating to finding the percent of a number and engaging the class in a number talk. See Jo Boaler’s video explaining the process of a number talk.
In a nutshell, a number talk is an opportunity for students to solve a problem using mental math strategies and asking students to share their methods while the teacher transcribes their solution in a visual representation and shares the visuals with the class. This provides students who are struggling with new approaches and for students who are finding the process easy to try and explore new methods.
Ask students to solve the following percent of a number using mental math strategies such as proportional reasoning to solve.
Students may need to be reminded that when a question states 125% of 10 that the 10 represents 100%. This gives two simple equations to work with:
10 = 100%
x = 125%
Calculate the Percent of a Number (T)
Students also need to be able to solve problems given fractional percentages, percents less than 1 and percentages more than 1.
Example:
This year at Halloween, Jane collected 187 pieces of Halloween Candy. Jane determined after analyzing her data that of all of her candy was inedible. She determined that she liked 62.5 % of her candy. Jane also compared her data to last year’s collection and determined that she has collected 107% of candy as compared to last year.
Help Jane determine how many pieces of candy are inedible, how many pieces of candy she would eat and how many candies she collected last year.
Students should also know how to use a calculator to solve percentage problems.
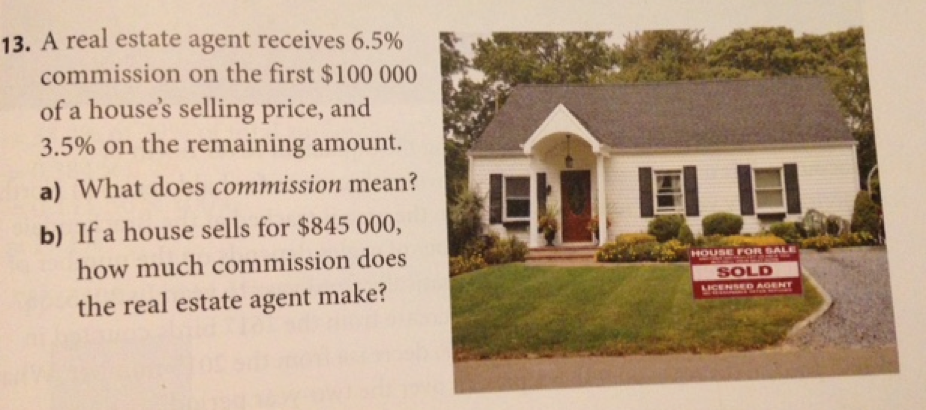
Check in with students with a question such as (Mathlink8, Section 8.3, #13):
Formative Assessment:
Students need to be able to convert numbers from one form to another. Questions such as: Convert 1.25% to a fraction and a decimal. Convert 7/18 to a percentage and a decimal. Convert 3.55 to a percentage and a decimal. (M)
Extension: (T)
Mathlinks 8 Page 248 #2:
Caleb, Jamal, and Mina are shopping for shoes. One of their favourite stores is having a ‘Buy two pairs, get one free” sale. Caleb chooses a pair of basketball shoes for $140, Jamal picks a pair of skate shoes for $110, and Mina settles on a pair of casual flat shoes for $90. The total cost is $250. How much should each friend pay? Try to find the fairest way possible. Justify your reasoning.
Lesson 8 - Combined Percents and Percent of a Percent
The Learning Events should always be prefaced by focusing on the essential questions:
- What is the best way to represent a quantity?
- What is the role of reasoning when making decisions?
Combined Percents and Percent of a Percent (Lesson 8)
Class activity: (M)
Provide students with 50 countable items such as multilink cubes, pennies, etc.
Ask students:
If you increase a number by 50% and decrease the result by 50% what happens to the original number? Show the original value, the increase and decrease. Draw your findings.
If you decrease a number by 50% and increase the result by 50% what happens to the original number? Show the original value, the decrease and increase. Draw your findings.
Choose and explore what happens with 3 other percentages?
Can you generalize what happens when you decrease than increase? Can you generalize what happens when you decrease than increase? Explain with visuals.
Problem: (T)
The original price of a shirt is $79.99. The original price was marked down 20%. A flash sale marked it down another 5%. Sales tax of 12% will be added at the till. What is the combined percentage of discounts and taxes? What is the final price of the shirt? Show the change in percent from 100 to each change.
Does it matter if you change the order of the decreases? What if the flash sale was followed by the discount? Is there a final price difference?
Use visuals to show your thinking.
Check for understanding with a question such as (Mathlinks8, Section 8.4, #11)
Which is greater, 60% of 50% of 40%, or 50% of 50% of 50%? Justify your reasoning.
Formative Assessment:
Check-in with students about their ability to calculate single percentages. For example, find 52% of 119. Add on a second calculation such as Find 52% of 25% of 119.
Extensions:
Mathlinks8, Page 294 #3. (T):
A baseball team has won 50 games out of the 75 played. The team has 45 games still to play. How many of the remaining games must the team win so that it wins 60% of its games for the whole season.
Student Work:
Students can complete question such as Mathlinks8, Section 8.4 #6-10 for a selection of questions showing combined percents.
Lesson 9 - Percent and Financial Literacy
The Learning Events should always be prefaced by focusing on the essential questions:
- What is the best way to represent a quantity?
- What is the role of reasoning when making decisions?
Percent and Financial Literacy (Lesson 9)
Class Activity: (T)
This would be a great activity to do in an Excel Spreadsheet.
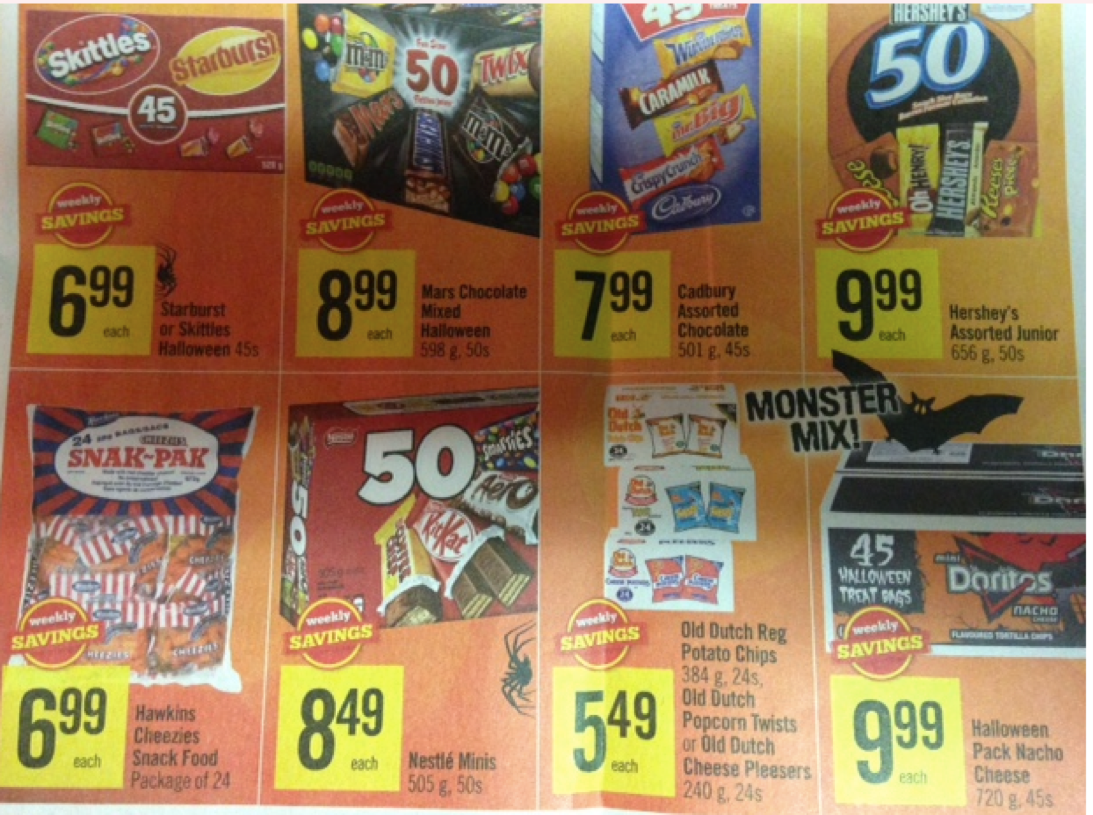
Suraj and Ethan are shopping for supplies for a school party for 30 students. They have a budget of $75.00. They can only purchase candy from the flyer (see attached). Shop for the class to maximize the number of candies for the group. Create a table showing your purchases. If you order more than $50 of candy, you will receive a 10% discount. Sales tax is 12% on all items. What is the combined percentage? Create an order that is under budget. Can each student be provided with 10 treats given this budget?
Adaptations:
Students may need support with lining up decimals.
Check for Understanding with a question such as (Mathlinks 8, Section 8.5, #17) (T):
A sound system is auctioned on the Internet. The starting bid is $100. The second bid is 135% of the first bid. The third bid is 257% of the second bid. There are then 5 more bids, each 10.5% over the previous bid. The winning bid comes with only seconds left and is only 0.1% greater than the previous bid. What is the winning bid? What assumptions did you make to arrive at your answer?
Formative Assessment:
Check in with students with simple questions such as an item costs $125.00. There is a discount of 15% and sales tax of 12%. Show calculations for each and a final price.
Student Work:
Students can complete questions such as Mathlinks8, Section 8.5 #6-13 for a selection of questions about percent and financial literacy.
Extension:
Students can explore interest rates of investment accounts and start to play with simple interest and/or compound interest calculations.

The following resources are made available through the British Columbia Ministry of Education. For more information, please visit BC’s New Curriculum.
Big Ideas
The Big Ideas consist of generalizations and principles and the key concepts important in an area of learning. The Big Ideas represent what students will understand at the completion of the curriculum for their grade. They are intended to endure beyond a single grade and contribute to future understanding.
Core Competencies
 Communications Competency
The set of abilities that students use to impart and exchange information, experiences and ideas, to explore the world around them, and to understand and effectively engage in the use of digital media
 Thinking Competency
The knowledge, skills and processes we associate with intellectual development
 Social Competency
The set of abilities that relate to students’ identity in the world, both as individuals and as members of their community and society
Curricular Competencies & Content
Curricular Competencies are the skills, strategies, and processes that students develop over time. They reflect the “Do” in the Know-Do-Understand model of curriculum. The Curricular Competencies are built on the thinking, communicating, and personal and social competencies relevant to disciplines that make up an area of learning.
Additional Resources
First People's Principles of Learning
To read more about First People’s Principles of Learning, please click here.
For classroom resources, please visit the First Nations Education Steering Committee.
